Sections 9A,9B
Functions, Linear Functions.
...
Generalities
The notion of function is designed to express the idea of dependency.
Specifically, a quantity depends on another one.
The change of one of them yields a change of the other.
Example: bacteria in a bottle.
The amount of bacteria changes with time.
Terminology
The two quantities are called variables.
A function describes how does dependent variable changes
when/if independent variable chages takes place.
Example: bacteria in a bottle.
Elapsed time since 11am is independent variable
Amount of bacterias is dependent variable.
Ways to present a function.
- mathematical formula
- graph
- data table
Formula in the example with bacteria in a bottle
\(N=2^t\)
Independent variable -- t -- time in minutes after 11:00am
Dependent variable -- N -- number of bacterias
Advantage of formula: easy to calculate
Disadvantage of formula: difficult to imagine
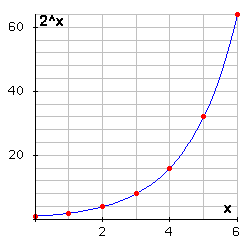
Graph in the example with bacteria in a bottle

Advantage of graph: easy to imagine
Disadvantage of graph: inaccurate readings
Data Table in the example with bacteria in a bottle
may be produced out of the formula \(N=2^t\),same applies to the graph:
| Elapsed time, t | Amount of bacterias, N |
|---|---|
| 0 | 1 |
| 1 | 2 |
| 2 | 4 |
| 3 | 8 |
| 4 | 16 |
| 5 | 32 |
| 6 | 64 |
Modeling our world
VERY ROUGHLY
One starts with an idea that there may be a dependency between two quantities.
One collects raw data, possibly organized into a data table
One draws a graph from this data table in order to visualize it
One tries to figure out a formula for the function whose graph is close to this one
This function is a model for the dependency
Simplest class of functions -- Linear Functions
Linear Modeling -- modeling with linear functions
For a function, one may ask how does the dependent variable change when the independent variable changes by a unit
\( \text{rate of change} = \frac{\text{change in dependent variable}}{\text{change in independent variable}} \)
Linear function has constant rate of change
Linear function has constant rate of change.

A car is traveling along the road with a speed of 60 mph. The distance of this car to its destination point depends on time. This distance is a linear function in time. It decreases by 60 miles every hour. That is its constant rate of change of -60.
Formula:
distance to destination = initial distance -60 \(\times\) time.
Linear Functions. General Formula
\(y=mx + b\)
was in example:
distance to destination = initial distance -60 \(\times\) time.
\(x\) - independent variable (was time)
\(y\) - dependent variable (was distance to destination)
\(m\) - rate of change aka slope of the graph (was speed of -60 mph)
\(b\) - initial value aka y-intercept on the graph (was 400 miles)
Concluding remarks
The graph of every linear function is a straight line
The slope of this line \( slope = \frac{\text{change in y}}{\text{change in x}} \)
indicates how much the dependent variable \(y\) changes when the independent variable \(x\) changes by 1.
However,
not every straight line can be a graph of a linear function.
Exception: vertical lines are not!
 They represent no dependency at all.
Instead of showing how \(y\) depends on \(x\)
this graph indicates that \(x\) does not depend on \(y\).